
Public Law l00-91 directs the Secretary of the Interior to study the effects of aircraft overflights at no fewer than ten units of the National Park System, and to provide information at each unit regarding
"... the impairment of visitor enjoyment associated with flights over such units of the National Park System. "
This chapter presents the results of two studies that were conducted in response to this requirement and that serve to identify the effects on visitors and also to provide a basis for using visitor reactions, as one measure among others, to identify, analyze and mitigate aircraft overflight sound produced impacts at units of the National Park system.
The two studies that serve as the basis for most of the analysis presented in this chapter are the Visitors Survey (McDonald et al. 1994) and the Dose-Response Study (Anderson et al. 1993). The Visitors Survey consists of two surveys of visitors: a visitor intercept survey conducted at exits to parks as visitors were departing, and a mail survey sent to a sub-group of these visitors. The Dose-Response Study included simultaneous sound level measurements and visitor interviews at specific sites which are overflown by aircraft on a regular basis. The Visitors Survey was designed to provide National Park system-wide estimates of visitor impacts, but the results also provide valuable information on the variation in effects from park to park. The Dose-Response Study examine visitor reactions to overflights of specific park locations and provides a quantitative relationship between aircraft sound level and visitors' reactions to these sound levels. The sections of this chapter examine in succession the effects on visitors system-wide, at specific parks, and at specific sites within parks. These effects, and in particular the results of the specific site Dose-Response Study, are then used as the basis for a process of identification, analysis and mitigation of overflight produced visitor impacts.
UNDERSTANDING VISITOR ENJOYMENT
In order to understand the following shifts of analysis from park system to individual parks to specific sites, it is necessary to understand how visitors report enjoyment and how the NPS views its mandate to provide for visitor enjoyment. In a recreational setting, visitor reports of enjoyment (or visitor satisfaction, as it is often termed in the literature) have two important qualities: 1) reports of satisfaction and dissatisfaction depend upon how specifically a visitor is questioned about an experience; 2) satisfaction cannot really be examined with a single measure, but consists of multiple satisfactions. First, previous work has shown that people evaluate their reactions to an event more reliably to the extent that they are questioned specifically about the event. In the context of examining the effects of overflights on visitors, questions asked about the effects of overflights at a specific site, asked right at the site were judged to provide more reliable reports of impact than questions asked at the time of exiting the park. Second, early research on visitor satisfaction centered upon a single measure of visitor satisfaction, but
Previous Chapter
Top of Chapter 6
Table of Contents
Return to NPC Library
Return to NPC Home Page
more recent efforts have indicated that a single overall measure is inadequate, and now conceptualize visitor satisfaction as consisting of multiple satisfactions. In other words, impacts on visitors from aircraft are only one of numerous factors that can affect visitor enjoyment. To understand visitor reactions to aircraft, visitors must be questioned specifically about aircraft.
What these two aspects of visitor satisfaction mean is that impacts of overflights can not be easily perceived by broad-brush examination of visitor satisfaction long after the experience with overflights occurs. Rather, direct questions about the perceived effects of overflights have to be asked specifically and close to the time of the experience. Though the visitor survey was conducted primarily to permit generalization to the entire park system, it also provides useful information for understanding the differences in the impacts of overflights at different parks. The Visitors Survey had two parts, an initial intercept survey at park exits and a follow-up mail survey. Results of the intercept survey are more representative of visitor reaction to overflights and less affected by passage of time after the possible exposure to the overflights. The best time to ask opinions about overflights is to ask shortly after the experience, as was done during the dose-response study conducted at specific sites.
By examining the effects of overflights on visitor enjoyment system-wide, at individual parks and at specific sites within parks, the following conclusions are drawn:
System-wide, on an annual basis, about one-fifth of all park visitors (88 million) report hearing aircraft, and two to three percent (nearly 7 to 12 million visitors) report impacts from these overflights. These numbers take on greater significance when problems are concentrated in a limited number of parks. So while problems are spread widely enough to make a systematic approach desirable, they make simple systemic solutions, like the setting of a minimum flight altitude over parks, impractical and inappropriate. A systematic approach to problem solving must be linked to understanding impacts on a park-by-park, site-by-site basis with careful consideration given to the types of visitor experiences that the park should be providing.
Visitor impacts vary significantly park-to-park, and the parks included in the Visitors Survey demonstrate this variability. The variation in visitor impacts across these parks correlates, though weakly, with NPS management rankings of park overflight problems and add weight to the conclusion that the 50 to 100 parks identified by management may be in need of investigation and remedy.
Locations that have significant overflight problems can be objectively identified and analyzed by using NPS guidelines that include setting limits on percentages of visitors impacted and on numbers of visitors impacted.
6.2 The System-Wide Impacts of Overflights on Visitors
The Visitors Survey was designed to provide information system-wide about how visitors feel about aircraft overflight related issues. Three survey objectives relate to understanding effects on visitor enjoyment. These objectives are:
Top of Chapter 6
Table of Contents
Return to NPC Library
Return to NPC Home Page
In order to permit generalization of the results to the park system, a five-stage sample design was used. This involved selecting: (1) NPS units from identified strata, (2) two-month sampling periods, (3) exits and days, (4) groups of visitors within those exit-days, and finally (5) a subset of visitors to receive a questionnaire in the mail. The result was two sets of survey results: those from visitors who were intercepted and interviewed as they exited the various parks, and those from visitors who also received the mail questionnaire. In the following discussions, the results from the intercept or exit survey are used to provide information about the three survey objectives listed above1. These results are based on visitor responses collected during the busiest two months of the season from visitors exiting during the busiest 6 hours of the day.
6.2.1 Importance of Natural Quiet
During the intercept survey, visitors were asked how important it was to be able "to enjoy the natural quiet and sounds of nature" and "to enjoy the natural scenery" as reasons for their visit to the park. Visitors were given five choices for responding: not at all important, slightly important, moderately important, very important and extremely important. Table 6.1 shows, based on the survey responses, what percent and what corresponding annual number of park visitors could be expected to answer moderately, very or extremely important to these reasons.
Table 6.1 Importance of Natural Quiet and Natural Scenery as Reasons for Park Visit
|
Reason for Park Visit |
|
|
|
Enjoy Natural Quiet
|
397.1 M 1.23 |
386.6 M to 407.6 M |
|
View Natural Scenery
|
408.0 M 0.98 |
399.7 M to 416.3 M |
a. Respondents who answered 3,4, or 5 on the following scale: 1 = not at all important, 2 = slightly important, 3 = moderately important, 4 = very important, and 5 = extremely important.
b. Estimate of the 1992 visitor population is 437. 8 million visitors. As used here, "visitor"
1. The mail survey results provide information about visitor perceptions of benefits and about approaches to management presented in Chapters 8 and 9.
Top of Chapter 6
Table of Contents
Return to NPC Library
Return to NPC Home Page
means one person exiting the park. Hence, if a person enters and leaves a park once each day for three days, that person is counted as three "visitors".
c Standard error is of the percent, not of the number of visitors.
d Number of completed interviews.
Conclusion 6.1
Enjoying the natural quiet is about as important as viewing natural scenery as a mason for visiting national parks. In both cases over 90 percent of the visitors report moderate to extreme importance for both.
6.2.2 Impacts Produced by Hearing and Seeing Aircraft
First, visitors leaving the parks were asked if they heard or saw "any airplanes, jets, helicopters or any other aircraft during your visit to" the park. Table 6.2 presents the results and estimates of the corresponding number of 1992 visitors who would have heard or seen aircraft.
Table 6.2 Numbers of Visitors who Reported Hearing or Seeing Aircraft
|
|
|
|
|
Heard aircraft
|
88.0 M 5.10 |
44.2 M to 131.8 M |
|
Saw aircraft
|
82.3 M 4.10 |
47.3 M to 116.3 M |
a See notes to Table 6.1.
Conclusion 6.2
About one fifth of all visitors to the National Parks (about 80 million visitors a year) remember seeing or hearing aircraft during their visit to the park.
Visitors who reported hearing or seeing aircraft were then asked whether they were bothered or annoyed by aircraft noise or by seeing aircraft. Visitors who heard aircraft were also asked whether the sounds of aircraft interfered with three aspects of their visit: enjoyment of the park; appreciation of the natural quiet and sounds of nature at the park; appreciation of the historical and/or cultural significance of the park. Visitors could respond with one of five answers for each question: not at all, slightly, moderately,
Top of Chapter 6
Table of Contents
Return to NPC Library
Return to NPC Home Page
very much, extremely. Table 6.3 gives the impacts for hearing aircraft, and Table 6.4 shows the reported annoyance for visitors who saw aircraft. The percents shown are percents of the total visitor population, not percents of visitors who heard or saw aircraft.
Table 6.3 Impacts that Resulted from Hearing Aircraft
|
Type of Impact |
|
|
|
Interfered with Visitor Enjoyment
|
8.3 M 0.65 |
2.6 M to 14.0 M |
|
Annoyed by Hearing Aircraft
|
7.0 M 0.77 |
0.4 M to 13.6 M |
|
Interfered with Appreciation of Natural Quiet
|
12.3 M 0.99 |
3.9 M to 20.6 M |
a. See notes to Table 6.1.
Table 6.4 Annoyance that Resulted from Seeing Aircraft
|
Type of Impact |
|
|
|
Annoyed by Seeing Aircraft
|
13.1 M 0.86 |
5.7 M to 20.6 M |
a. See notes to Table 6.1.
Top of Chapter 6
Table of Contents
Return to NPC Library
Return to NPC Home Page
Conclusion 6.3
About 2 to 3 percent of all visitors, or roughly from 7 to 13 million visitors annually, can be expected to report impact from hearing or seeing aircraft overflights.
6.2.3 Impacts Among Different User Groups Produced by Hearing Aircraft
Impacts of overflights on different user groups were also examined. Three visitor groups were identified: frontcountry, backcountry, and overnight backcountry permit holders. Visitors who completed the exit survey could be categorized based on their primary recreational activity. Those who indicated their primary activity was backpacking or hiking were classified as "backcountry" users, while all other surveyed visitors were classified as "frontcountry". The third group, the backcountry permit group, is a sample of permit holders from those NPS units that require a permit to stay overnight in the backcountry. These permit holders were surveyed by mail.
Figure 6.1 shows the percentages of visitors in each of the three groups who remembered and reported hearing aircraft, who were annoyed, who indicated aircraft sound interfered with their enjoyment, and who indicated aircraft sound interfered with their appreciation of natural quiet and sounds of nature. Frontcountry visitors are less likely to report hearing aircraft, and to be less impacted by aircraft sounds than backcountry visitors. Such differences could be attributed to a number of factors. First, aircraft may be less likely to fly at lower altitudes near more populated frontcountry areas, possibly avoiding areas where typical frontcountry activities occur. Second, backcountry visitors may spend a much longer period of time in the park, thus increasing their opportunities to hear aircraft. Third, backcountry visitors typically spend a greater portion of their visit away from crowds, traffic, noise, etc., in locations where aircraft sounds may be more intrusive. Fourth, previous research has shown that backcountry and frontcountry visitors generally have different expectations and are seeking different experiences in visits to national parks.
Conclusion 6.4
A higher percentage of backcountry than frontcountry visitors report hearing aircraft and are more likely to experience impact from these aircraft. Though the reasons for these differences have not been identified, it is clear that hiking and backpacking do not remove visitors from the impacts of overflights.
6.3 Impacts at Specific Parks and at Specific Sites
The previous section presented the broad, system-wide picture of the impacts on visitors produced by aircraft overflights. However, both the Visitors Survey and the Dose-Response Study provide more information about visitor reactions to overflights, the distribution of overflight impacts on visitors, the relation of sound level to visitor reaction, and factors affecting visitor reactions. This section presents this additional information by examining the study results for specific parks and for specific sites within parks.
Top of Chapter 6
Table of Contents
Return to NPC Library
Return to NPC Home Page
Top of Chapter 6
Table of Contents
Return to NPC Library
Return to NPC Home Page
6.3.1 Impacts at Specific Parks
PERCENTAGES OF BISITORS IMPACTED
The Visitors Survey was conducted at a carefully designed and selected sample of units of the National Park System. This sample was drawn to permit generalization of results to the entire non-Alaskan system of parks. However, examination of the data from these individual parks indicates that a wide variation in overflight produced impacts exist. Table 6.5 lists the parks where visitors were surveyed. It gives also the numbers of visitors who were surveyed as they exited the park, and the percent of visitors, weighted to reflect the told number of visits during the two month survey period, who expressed annoyance, stated that the sound of aircraft interfered with their enjoyment of the park or with their appreciation of the natural quiet and sounds of nature.
Table 6.5 Reported Exposure and Impact from Hearing Aircraft at Visitors Survey Parks
|
|
|
|
| |||
|
|
|
|
|
|
| |
|
National Park Unit Surveyed |
Number of Visitors Interviewed |
|
|
|
| |
|
|
Assateague Island NS |
|
|
|
|
|
|
|
Bandelier National Monument |
|
|
|
|
|
|
|
Buffalo National River |
|
|
|
|
|
|
|
Canaveral National Seashore |
|
|
|
|
|
|
|
Cape Cod National Seashore |
|
|
|
|
|
|
|
Cape Hatteras NS |
|
|
|
|
|
|
|
Casa Grande NM |
|
|
|
|
|
|
|
Cumberland Island NS |
|
|
|
|
|
|
|
Delaware Water Gap |
|
|
|
|
|
|
|
Dinosaur National Monument |
|
|
|
|
|
|
|
Everglades National Park |
|
|
|
|
|
|
|
Fort Sumter NM |
|
|
|
|
|
|
|
Fredericksburg & Spotsylvania |
|
|
|
|
|
|
|
Gettysburg NMP |
|
|
|
|
|
|
|
Glacier National Park |
|
|
|
|
|
|
|
Glen Canyon NRA |
|
|
|
|
|
|
|
Grand Canyon National Park |
|
|
|
|
|
|
|
Great Smokey Mountains |
|
|
|
|
|
|
|
Gulf Islands National Seashore |
|
|
|
|
|
|
|
Haleakala National Park |
|
|
|
|
|
|
|
Hawaii Volcanoes NP |
|
|
|
|
|
|
|
Hot Springs National Park |
|
|
|
|
|
|
|
Kings Canyon & Sequoia NP |
|
|
|
|
|
|
|
Lake Mead NRA |
|
|
|
|
|
|
|
Lake Meridith NRA |
|
|
|
|
|
|
|
Lassen Volcanic NP |
|
|
|
|
|
|
|
Mount Rainier National Park |
|
|
|
|
|
|
|
Mount Rushmore NM |
|
|
|
|
|
|
|
North Cascades NP |
|
|
|
|
|
|
|
Olympic National Park |
|
|
|
|
|
|
|
Perry's Victory |
|
|
|
|
|
|
|
Rocky Mountain NP |
|
|
|
|
|
|
|
Saguaro National Monument |
|
|
|
|
|
|
|
Shenandoah National Park |
|
|
|
|
|
|
|
Sleeping Bear Dunes NL |
|
|
|
|
|
|
|
Walnut Canyon NM |
|
|
|
|
|
|
|
Wilson's Creek NB |
|
|
|
|
|
|
|
Yellowstone National Park |
|
|
|
|
|
|
|
Yosemite National Park |
|
|
|
|
|
a. Percents are based on weightings using actual numbers of visitors to each park during the survey periods
b. Respondents who answered 3,4 to 5 on the following scale: 1 = not at all, 2 = slightly, 3 = moderately, 4 = very much and 5 = extremely
Top of Chapter 6
Table of Contents
Return to NPC Library
Return to NPC Home Page
Conclusion 6.5
Park visitor reports of exposure to aircraft (hearing aircraft) and of impacts from the exposure vary widely from park to park.
Figure 6.2 presents graphically for each of the Visitors Survey parks two of the quantities listed in Table 6.5 : percent of visitors who reported hearing aircraft and the percent of visitors who were annoyed. The numbers next to the points in the figure indicate the specific park as listed in Table 6.5. As shown, parks with higher percentages of visitors reporting hearing aircraft also tend to have larger percentages of visitors annoyed by the aircraft.
Low percentages of visitors impacted in Table 6.5 and Figure 6.2 do not necessarily imply no overflight noise problems exist. First, the Dose-Response Study, discussed in more detail below, shows that significant impacts to visitors can occur at specific sites. Figure 6.3 shows the same variables, percent who heard aircraft and percent who were annoyed, for five specific sites. Haleakala, Hermit Basin (in the Grand Canyon), and Wahaula (Hawaii Volcanoes) all showed more than 20 percent of the visitors to these specific sites were annoyed. In Figure 6.2, Haleakala, number 20, Grand Canyon, number 17, and Hawaii Volcanoes, number 21, all show less than 10 percent of visitors reporting annoyance with the sound of aircraft overflights. If parks such as these that show 5 to 10 percent of the visitors are impacted can also have sites in the park where more significant numbers are affected, it is likely that the parks of Figure 6.2 that have more than 10 percent of visitors annoyed also have specific sites where significant percentages of visitors are impacted.
Conclusion 6.6
The nature and severity of impacts at specific sites within parks may not be captured by the judgments gathered in the exit Visitors Survey.
NUMBERS OF VISITORS IMPACTED
The impacts of overflights at the specific parks may also be examined by estimating the numbers of visitors annoyed during the two month sample periods. Figure 6.4 is like Figure 6.2, except estimated numbers of visitors are used rather than percents of visitors. Note that Grand Canyon, 17, Haleakala, 20, and Hawaii Volcanoes, 21, all are estimated to have more than 10,000 visitors impacted during the two month survey period. Table 6.6 lists the parks of Figure 6.4 having more than 10,000 visitors impacted.
Top of Chapter 6
Table of Contents
Return to NPC Library
Return to NPC Home Page


Top of Chapter 6
Table of Contents
Return to NPC Library
Return to NPC Home Page

Top of Chapter 6
Table of Contents
Return to NPC Library
Return to NPC Home Page
Table 6.6 Visitor Survey Parks with More than 10,000 Visitors Impacted by Overflights During Survey
National Park Unit 5
Cape Cod National Seashore
11
Everglades National Park
15
Glacier National Park
16
Glen Canyon NRA
17
Grand Canyon National Park
18
Great Smoky Mountains NP
19
Gulf Islands National Seashore
20
Haleakala National Park
21
Hawaii Volcanoes NP
24
Lake Mead NRA
27
Mount Rainier National Park
28
Mount Rushmore NM
29
North Cascades NP
35
Sleeping Bear Dunes NL
38
Yellowstone National Park
39
Yosemite National Park
COMPARISON OF PARK SPECIFIC IMPACTS WITH MANAGEMENT RATINGS
Three different rankings of parks with potential overflight problems were developed. First, the National Park Service developed a ranking from 1, most severe, to 9, the least severe for parks within each NPS region. Second, NPS developed a national ranking from 1, greatest potential for aircraft overflight exposure, to 3, the least potential. Third, a ranking of "exposure" was developed based on limited information about flight routes and air traffic information (Tabachnick et al. 1992). These three rankings were examined for correlation with visitor reports of hearing aircraft, and with visitor reports of impact (McDonald et al. 1994). Modest correlations were found for the NPS management rankings and hearing aircraft, and weak correlations with impact (annoyance, interference with enjoyment or with appreciation of natural quiet). The exposure metric, developed from incomplete information about routing of flights and operations numbers, correlated to little or no extent with visitor responses.
Figures 6.5, 6.6 and 6.7 show the relationship of the NPS national ranking and the parks included in Pubic Law 100-91 with hearing aircraft and annoyance for the parks of the Visitors Survey. These figures show the tendency for the higher ranked parks to be parks were greater percentages of visitors report hearing aircraft and where greater percentages or numbers of visitors are impacted by hearing aircraft. Reasons for differences between management rankings and visitor reactions can be many: management knows the purpose and mission of the parks; visitors are at parks generally a few days at most; visitors have limited experience with the opportunities offered by the park. Nevertheless, very few of the parks with the higher visitor impacts are excluded from the higher management rankings.
Top of Chapter 6
Table of Contents
Return to NPC Library
Return to NPC Home Page


Top of Chapter 6
Table of Contents
Return to NPC Library
Return to NPC Home Page

Top of Chapter 6
Table of Contents
Return to NPC Library
Return to NPC Home Page
Conclusion 6.7
NPS management rankings provide a reasonable approach to identifying parks with potential overflight problems, and the management perspective is likely to identify the parks with the most severe visitor impacts.
6.3.2 impacts at Specific Sites
The preceding sections of this chapter presented visitor perceptions of overflight impacts for the park system as a whole, and showed the variation in visitor perceptions from park to park. Since the Visitors Survey could not identify what sound levels the visitors experienced, where they went in the parks, or how long they stayed in different areas of the park, there is no means for inferring this information, and no way to answer questions that would help quantify the relationship between visitor reports of impact and aircraft sound level. Since the Visitors Survey could not provide any information about sound levels experienced by visitors, the Dose-Response Study (described in Anderson et al, 1993) was designed and conducted to answer the following three questions.
1. Does impact as reported by visitors depend upon sound levels produced by aircraft overflights?
2. If so, what is the relationship between reported impact and aircraft sound levels?
3. What factors other than aircraft sound affect visitor impacts?
A dose-response relationship may be thought of as a curve on a graph that tells what percent of visitors report impact (their response) versus the "dose" of aircraft overflight sound. Dose-response relationships have long been used to help understand reactions to noise in communities around airports but, prior to this dose-response study, there were no data relating how visitors to national parks react to the sound of aircraft overflights.
Dose-response relationships were developed by measuring sound levels in an area of a park while simultaneously interviewing visitors who had passed through or visited the area. Preparation for data collection and analysis was lengthy, and was highly influenced by the knowledge that, although dose-response studies are common in urban airport environments, this exact type of study in a park environment had never before been attempted. Hence, decisions were made to maximize the likelihood that useful data would be acquired. Such an approach meant that variables needed to be limited, measurement techniques had to be as simple as possible, and that study areas had to be carefully chosen. Table 6.7 lists the specific areas studied, the park, the type of area, the dates of data collection, number of visitors interviewed and the approximate numbers of aircraft heard per hour.
Top of Chapter 6
Table of Contents
Return to NPC Library
Return to NPC Home Page
Table 6.7 Dose-Response Data Collection Study Areas
|
|
|
|
|
|
|
|
|
|
|
|
|
|
|
|
|
|
|
|
|
|
|
|
|
|
|
|
|
|
|
|
|
|
|
|
|
|
|
2, 3, 4, 5 Oct. |
|
|
|
|
|
Frontcountry, short hike |
|
180 |
|
THE DOSE-RESPONSE CURVES
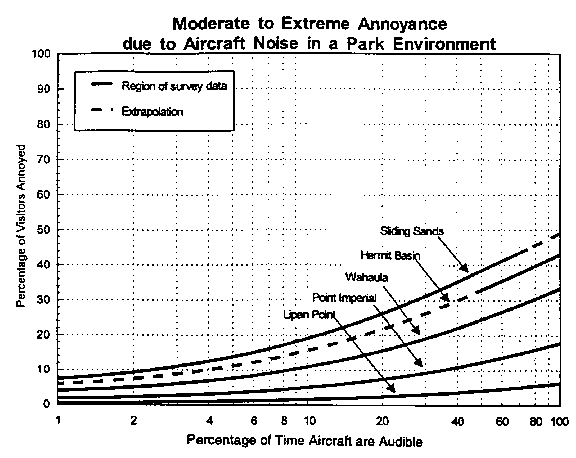
Figures 6.8 and 6.9 present dose-response curves that were developed from the data for each of the study areas.2 In each, the horizontal axis gives the dose, while the vertical axis gives the response, and the curves show the relationship between the two. The two figures are for two doses and one response. The doses are percent of time aircraft are audible, and hourly equivalent level, Leq,1hr for audible aircraft3. The first, percent of time audible, was determined by logging the start and end times of all audible aircraft overflights. These logs were later correlated with the period of time each interviewed visitor was on site to determine the amount of time each visitor could have heard aircraft. The Leq,1hr was determined by continuously measuring sound levels, then computing for 1 hour periods for each visitor,
2. Because of the limited number of interviews at Havasu Creek and because aircraft sound levels were so close in level to the non-aircraft background levels that doses could not be computed, the Havasu Creek data could not be used in developing the dose-response curves.
3. Percent of time aircraft are audible, while simple to measure, is extremely difficult to predict. On the other hand, measurement of Leq,1hr of audible aircraft is somewhat difficult, but reasonably easy to predict with current available computer models. Hence, dose-response curves for both metrics have been developed to provide the tools necessary for measurement, analysis and mitigation of overflight noise problems in parks, see section 6.4. Leq,1hr is the computed dose that occurred during the hour that the visitor was at the site. Use of this dose for assessing a site assumes that the relationship between Leq,1hr and the actual dose received by the visitor at the site is similar to the relationship at the dose-response sites were the data were collected.
Top of Chapter 6
Table of Contents
Return to NPC Library
Return to NPC Home Page

Top of Chapter 6
Table of Contents
Return to NPC Library
Return to NPC Home Page
the equivalent level of the sound levels that occurred when aircraft were audible (corrected for non-aircraft sound levels). The response is percent of visitors who said they were annoyed by aircraft noise while at the site4. The solid portion of the curve shows where the data lie, the dashed portions are extrapolations based on analysis.
The dose-response curves, to the extent that they are applicable to a given site, can be used to predict visitor responses (impacts) by measuring (or predicting) dose. For example, if monitoring at a site similar to Sliding Sands shows aircraft audible about 30 percent of the time, then Figure 6.8 predicts that about 32 percent of the visitors will be annoyed. Alternatively, if Leq,1hr of 40 dB from audible aircraft were measured or predicted for the site, Figure 6.9 shows that about 37 percent of the visitors will be annoyed. Thus through measurement and/or prediction, the magnitude of the visitor impacts may be determined. Analytical methods can then be used to identify possible solutions. Section 6.4 below discusses such a monitoring, analysis and mitigation process in more detail.
Conclusion 6.8
Visitors report negative reactions to the sound of aircraft at specific sites, and these negative reports increase as exposure to aircraft sounds increase.
These curves demonstrate that sound exposure, though an important variable, is not the sole determinant of impact on visitors. Not only do the impacts on visitors clearly vary considerably from one site to another, but statistical testing of the data has shown that several other specific factors affect visitor response. Though the importance of these factors varies depending upon which dose and which response are examined, some generalizations are possible. First time visitors to a site are less sensitive to aircraft sound than are repeat visitors; visitor "groups" of one or two people are more sensitive than are larger groups; visitors who thought enjoying the natural quiet and sounds of nature was a very or extremely important reason for visiting the site were more sensitive to aircraft sound than visitors who judged quiet and sounds of nature as less important. These three factors can have a significant effect -on visitor response. Repeat visitors, or groups of 1 or 2, or visitors who rate quiet as very important respond as if the sound were about two to three times as long or about 20 dB louder when compared with first time visitors, larger groups, or visitors who do not so highly value quiet.
The dose-response data also suggest other factors that may be important in affecting how visitors respond, but lack of data prevented developing statistically verifiable results. The type of site is clearly important, since the curves vary from site to site; what is unknown is what characteristics of the site are important. For example, the non-aircraft sound levels at a site seem to affect response, the higher the non-aircraft sound levels, the less the visitor response. Sites that are more easily accessible seem to be visited by a population of visitors that are less sensitive to aircraft sounds; conversely, the less accessible sites, where visitors must walk some distance, may attract more sensitive groups of visitors. Virtually all overflights
4. The response of annoyance rather than interference with enjoyment was chosen for two reasons. Primarily, annoyance is the metric of response that has been used for almost two decades to assess the impact of intruding sounds, and particularly aircraft sounds on humans. The use of annoyance thus continues a well-established approach. Second, visitor impact in terms of annoyance and in terms of interference with enjoyment have proven to be virtually identical, see for example Table 6.5. Curves were also developed for the dose of interference with the natural quiet and sounds of nature.
Top of Chapter 6
Table of Contents
Return to NPC Library
Return to NPC Home Page
were light tour propeller and helicopter aircraft, flying at moderate altitudes (less than 1000 to 2000 feet, but generally higher than several hundred feet); visitor responses to aircraft at very high or very low altitudes, or to other types of aircraft, especially jets, are unknown. More data are needed if these factors are to be reliably identified and quantified.
Conclusion 6.9
Dose-response curves quantify the relationships between overflight sound levels and visitor impacts. Not all non-sound level factors that influence visitor impacts can be identified, but sufficient information is available that careful use of the dose-response curves can identify sites likely to produce significant impacts on visitors.
6.4 Identification, Analysis and Mitigation of Impacts
When used in conjunction with NPS management judgment, the dose-response results provide a means for quantitatively identifying and rank ordering sites within parks that potentially produce significant impacts on visitors. This section presents in outline form a method that can be used for the process of identification, analysis and mitigation of the types of visitor impacts discussed in previous sections of this chapter.
NPS management judgment and priority setting provide the primary basis for initial identification of units of the National Park System likely to have areas where overflights are producing significant visitor impacts. Not only does the management perspective consider the purposes, resources and intended recreational opportunities of the parks but, as discussed above in section 6.3.1, the management perspective as reflected in the NPS management rankings of parks demonstrates some correlation with the impacts reported by visitors for the Visitors Survey parks. Hence, the rust step in identification of potential problem areas is to use the management rankings of highest concern parks (50 to 100 parks), identify the top priority parks for problem solving, and then identify the most impacted sites within them.
Identifying candidate sites within the priority parks will require an orderly identification of site characteristics. Important criteria for consideration will include:
1. Frequency of Overflights - How many overflights per hour occur regularly during periods of visitation?
2. Visitation Rates - How many visitors per hour or per day pass through the candidate site?
3. Recreational Opportunity - What are the important dimensions of the intended opportunity: unobstructed views, solitude, remote location, transportation access, etc.?
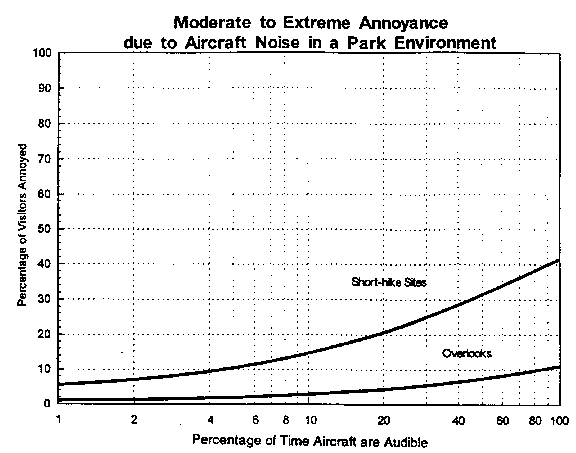
Once candidate sites are identified, the dose-response curves based on the percent of time aircraft are audible can be used by park personnel to develop a quantitative evaluation of the site. Percent of time audible data can be easily collected and compared with an appropriate dose-response curve for the site. Ideally, the curve used would be the one derived from the dose-response site most similar to the site in question. However, to simplify selection of the appropriate curve, Figures 6.10 and 6.11 have been developed. Each provides a curve for two generic types of sites: short-hike (or backcountry) and overlooks (or front country) sites. The "Short-hike Sites" curves are derived from the results obtained at Hermit Basin, Sliding Sands Trail and Wahaula Temple, weighted for sample size and statistical reliability. The "Overlooks curves " are similarly derived from the Point Imperial and Lipan Point data.
Top of Chapter 6
Table of Contents
Return to NPC Library
Return to NPC Home Page

Top of Chapter 6
Table of Contents
Return to NPC Library
Return to NPC Home Page
Figure 6.10 is to be used for sites where preservation of natural quiet is not one of the primary concerns, while Figure 6.11 provides curves to be used for sites where preservation of natural quiet is very important.
Park personnel would collect time audible data, using a carefully designed sampling procedure, and compare the results to the appropriate curve to estimate the degree of impact. The NPS would set criteria for acceptable degrees of impact, identifying both maximum acceptable percentages and maximum acceptable numbers of visitors impacted for each type of site or activity. If these maximums are exceeded, the NPS would initiate a process of analysis and interaction with aircraft operators and other agencies (e.g., the FAA, DOD, etc.) to eliminate or reduce the impacts.
The criteria for maximum acceptable impact would be developed by the NPS in terms of both percent of visitors to a site and numbers of visitors to a site. In terms of percent of visitors, a maximum acceptable value might be between 20 and 30 percent. Then, for example, where park measurements show a dose that results in more than 25 percent of visitors impacted, analysis and mitigation efforts would commence. Maximum acceptable numbers of visitors impacted would also be identified.
A flexible approach to analysis and mitigation will be developed and pursued. In some cases, for example, discussions with aircraft operators may identify simple changes (for example re-routings of air tours) that can be tested, found to provide acceptable reductions of impact, and implemented. In other cases, detailed analyses of many alternatives may be necessary. In such cases, the simple time audible metric can no longer be used. This metric, as mentioned, is extremely difficult to predict, and the alternative dose-response curves using hourly equivalent sound level, Leq,1hr, of audible aircraft will be employed.
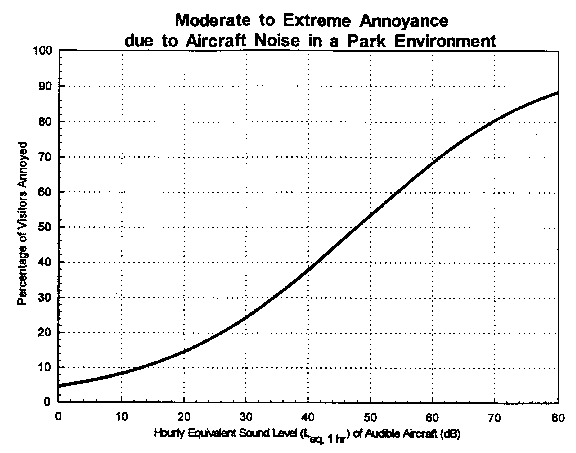
Detailed analyses of aircraft produced sound levels have long been conducted for airports and military air facilities. These efforts have resulted in computer models that can predict, generally within acceptable tolerances, how sound levels on the ground will be altered by changes in airspace use. These models are being adapted or expanded to provide predictive capabilities for aircraft overflights of parks (Reddingius 1994). Using these computer models and information about airspace use including aircraft types, number of flights per day, location of flight corridors, altitudes of flights and terrain features, Leq,1hr, can be computed for current operations and predicted for future or proposed operations, and Figures 6.12 or 6.13 can be used to estimate resulting visitor impacts.
As discussed above, ideally the curve used would be the one derived from the dose-response site most similar to the site in question. However, since current understanding of all of the factors that distinguish one dose-response site from another is limited, the curves of Figures 6.12 and 6.13 are conservatively (in a protective sense) derived from the results for the study area that consistently had the highest level of visitor response for a given level of aircraft sound, Sliding Sands at Haleakala National Park. The curves for Sliding Sands are higher than those for Wahaula Temple, Point Imperial, and Lipan Point. The curves for Sliding Sands are slightly lower than those for Hermit Basin, but the Sliding Sands curves were chosen over those for Hermit Basin due to the larger sample size and greater range of Leq,1hr measured at Sliding Sands, see Table 6.7 and Figure 6.9.
Top of Chapter 6
Table of Contents
Return to NPC Library
Return to NPC Home Page

Top of Chapter 6
Table of Contents
Return to NPC Library
Return to NPC Home Page
Using the computer models, working with aircraft operators and appropriate other government agencies, NPS would quantify alternatives and identify effective, feasible changes that reduce visitor impacts to acceptable levels.
There are some limitations to this approach to identification, analysis and mitigation, and these limitations derive from the limited data upon which the dose-response curves are based. NPS will recognize the following limitations in use of these curves.
1. The curves are based on visits to specific areas, not visits to entire parks. The study's data were collected on visitor reactions and sound levels in specific areas, and therefore should be applied to visits to specific areas only and not extended to an entire park visit. Many sites within a park may be individually considered, but there is no simple way to extend the results to overall visitor reactions that result at the end of a stay in a park.
2. The curves are based on visits of relatively short duration. All study areas were located where visitors were in the area for periods of 2 hours or less. The results have not been tested for visits of much longer duration, such as daylong or overnight stays, though sites with longer visit durations of up to four to five hours can probably be analyzed accurately.
3. The curves apply to audible aircraft sounds only. The dose-response curves, in terms of Leq,1hr, are for use where aircraft are audible. Predictions of aircraft sound levels may not accurately account for all aspects of aircraft sound generation and propagation, so care must be used in developing estimates of Leq,1hr that take audibility into account. For example, moving aircraft flight corridors may result in some types of aircraft, or some portions of aircraft flight, becoming inaudible at a specific site. This reduction in audibility must be incorporated into Leq,1hr if Figure 6.12 or 6.13 is to provide accurate estimates of impact.
4. The curves are based on scenic parks. The parks in which the data were collected all attract visitors for their scenic, natural qualities. At the selected study areas, visitors were hiking or sight-seeing outdoors. The background environments at these areas were primarily natural, although human noises and parking lot noises were present at the overlooks. The results can probably be used for other scenic natural parks with similar conditions, and for visitors participating in similar activities, but their applicability to sites with indoor activities or to strictly cultural or historic parks, or parks in urban or suburban areas has not been verified.
5. The curves are based on tour aircraft in level flight. Primarily light propeller and helicopter tour aircraft in level flight were observed during data collection. The results may be applied to similar conditions, but their applicability to jet aircraft, very large aircraft, or to areas where aircraft are noticeably climbing or descending has not been tested.
Top of Chapter 6
Table of Contents
Return to NPC Library
Return to NPC Home Page
SYSTEM-WIDE
For the National Park System as a whole, about one-fifth of the visitors (88 million) report hearing or seeing aircraft, and 2 to 3 percent of all visitors (7 to 12 million visitors) report having their enjoyment interfered with, being annoyed or having their appreciation of natural quiet interfered with by the sound of aircraft. The NPS has a problem. It is not systemic with problems in every park. The number of parks and visitors impacted is limited. Rather, it is the case that serious problems are occurring in a limited number of parks scattered across the country in which pockets of visitors are impacted. It is a serious problem in search of a measured solution. The NPS considers it akin to the proverbial canary in the mine; finding solutions should not be delayed while the duration of the canary's song is measured.
Yet the complexity of park overflight problems does not lend itself to simple solutions such as setting minimum altitude restrictions for flights over all parks. A systematic approach is needed, but an approach that will focus on the most serious problems and have them understood in terms of impacts on visitors, individual parks, and specific locations within parks.
INDIVIDUAL PARKS
Visitor impacts vary widely park to park. Low percentages of visitors impacted, however, cannot be taken to mean that there are no locations within a park where significant impacts occur. NPS management rankings show a modest, but recognizable correlation with visitor impacts.
The conclusion is that very different numbers of visitors report impacts from overflights, park to park, and that park management has been able to provide a reasonable rank ordering that shows some correspondence with these variations. Hence, out of a total of about 340 park units, there may actually be about 50 to 100 parks (6 PL 100-91 units, 49 Management Rank 1 units and 45 Management Rank 2 units) with overflight problems in need of investigation and remedy.
SPECIFIC SITES
All system-wide and park specific conclusions about impact on visitor enjoyment are based only on visitor responses with no knowledge of visitor exposure to aircraft sound. The site specific dose-response data provide both visitor response and aircraft sound exposure. These data show that visitors who are exposed to the sound of aircraft do report impacts, and that reports of impact increase with increasing exposure to aircraft sound. Further, reports of impact are dependent upon many factors that may or may not be related to the specific site. Such differences in response. by sound exposure and by location have three major implications. First, lowering sound exposure will reduce impacts on visitors, meaning that some reduction of sound levels is beneficial even if total elimination of intruding aircraft sound cannot be achieved. Second, the NPS can set guidelines for minimizing impacts on visitors by selecting maximum acceptable percents and numbers of visitors impacted at a specific park site or for a specific recreational opportunity. Third, some areas and visitor activities are more important to isolate from overflights than others, meaning that moving overflights to less sensitive areas of a park may be warranted.
Next Chapter
Top of Chapter 6
Table of Contents
![]()